



b2venture
Venture Capital
Bringing portfolio, fund and investor reporting into one view
How b2venture built a single source of truth for its team and its investors.
LP PortalRead story
Operating models
NAV OversightTrusted fund data from any administrator In-HouseRun your books on Quantium All solutionsBy requirement
Solutions
NAV Oversight In-House All solutionsBy requirement
NAV Verification & ReconciliationMulti-Administrator ConsolidationFund Accounting & Partnership AllocationsInvestor Reporting & LP PortalPortfolio MonitoringWaterfall & Carried InterestInvestment Book of Record (IBOR)Capital Calls & DistributionsFund Performance & Track Record ReportingPrivate Credit Loan ManagementSPV & Management Company AccountingBy firm type
Private Equity & Venture CapitalPrivate CreditFund-of-Funds & LPsFund AdministratorsPortfolio Monitoring
Company files arrive in different formats and at different times, and their metrics do not always compare. Quantium’s portfolio monitoring module helps investment and finance teams collect, check and report portfolio information consistently.
Where this goes wrong today
One company reports sales, another net revenue, a third ARR.
Without agreed definitions, a portfolio dashboard places unlike numbers side by side. And the week before the board pack is due, the team is still chasing the files that have not arrived.
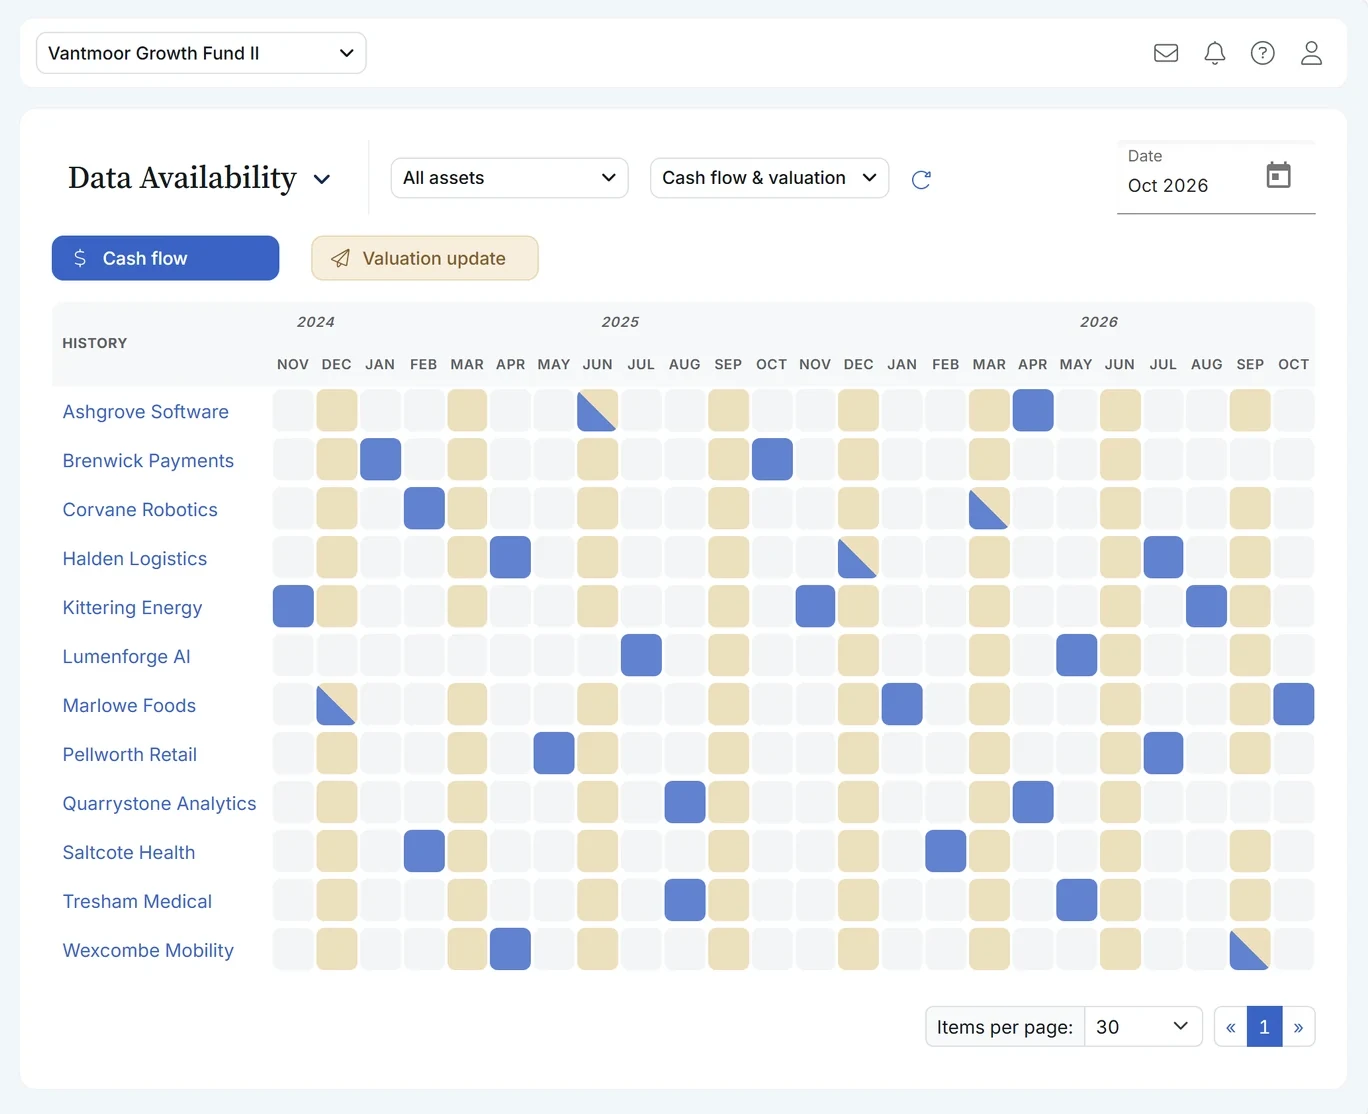
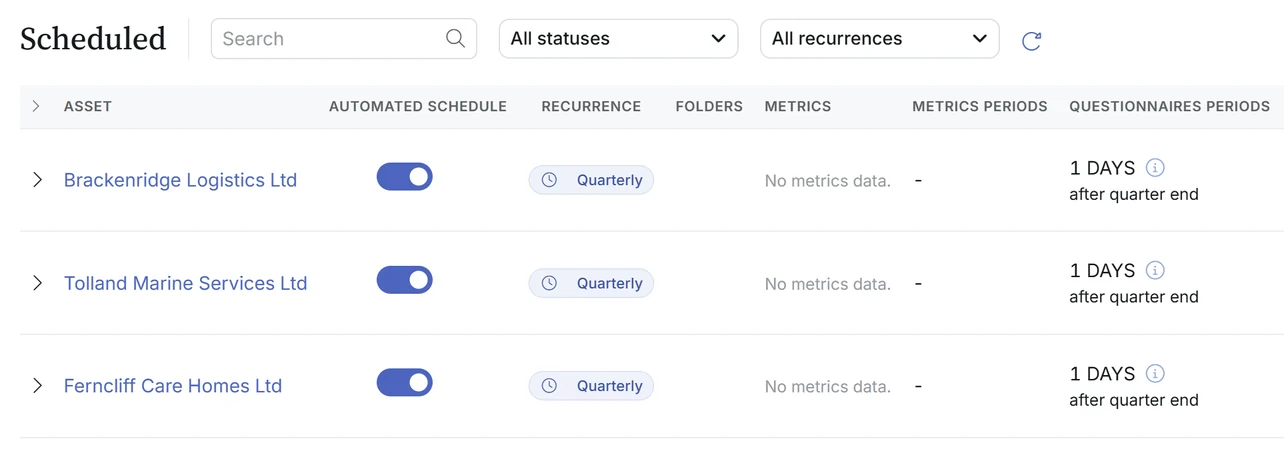
Request financial statements, budgets, KPIs and supporting documents from portfolio companies. Track submissions against the reporting calendar and follow up on outstanding items before the board or LP pack is due.
The process shows which figures are current, which are outstanding and which need review, rather than simply storing files in a folder.
Quantium maps each company's reported line items to your defined measures. Unlike measures stay separate: ARR is not treated as revenue because a template has a revenue field.
Capture the source and reporting period, review unusual movements and compare results over time. AI-assisted extraction works on supported Excel and PDF formats, and every extracted figure is reviewed before it is used.
Oakwell Healthcare Ltd / Metrics
AI Extraction
Oakwell Healthcare Ltd
Management accounts · Quarter ended 30 September 2026
Income statement USD 000
| Q3 2026 | Q3 2025 | |
|---|---|---|
| Revenue | 14,820 | 13,105 |
| Cost of sales | (8,410) | (7,560) |
| Gross profit | 6,410 | 5,545 |
| Operating expenses | (3,960) | (3,610) |
| Adjusted EBITDA | 2,450 | 1,935 |
Balance sheet and operations
| Cash | 6,300 | 5,140 |
| Net debt | 18,900 | 20,250 |
| Care sites | 12 | 11 |
| Headcount (FTE) | 412 | 388 |
| Patients treated | 48,200 | 43,950 |
Unaudited. Prepared for shareholders.
| Metrics | Unit | Q3 2026 | ||
|---|---|---|---|---|
| Revenuefrom “Revenue” | Currency | 14,820 | Page 2 | |
| Gross profitfrom “Gross profit” | Currency | 6,410 | Page 2 | |
| EBITDASuggested metricsfrom “Adjusted EBITDA” | Currency | 2,450 | Page 2 | |
| Net debtfrom “Net debt” | Currency | 18,900 | Page 2 | |
| Headcountfrom “Headcount (FTE)” | Number | 412 | Page 2 | |
| Patients treatedNew metricsfrom “Patients treated” | Number | 48,200 | Page 2 |
Illustrative example in the layout of Quantium EDGE. Nothing reaches your portfolio data until someone approves it.
Review company KPIs alongside valuations, investment cash flows, ownership, cap tables and relevant ESG or credit metrics. Portfolio and finance teams assess operating performance in the context of each investment.
Show the company trend, the change in value and the return history without assembling disconnected spreadsheets.
Revenue, margin, growth and the source of each figure.
Ownership, cap table, valuation history and cash flows.
Company one-pagers, portfolio packs and comparisons by strategy and vintage.
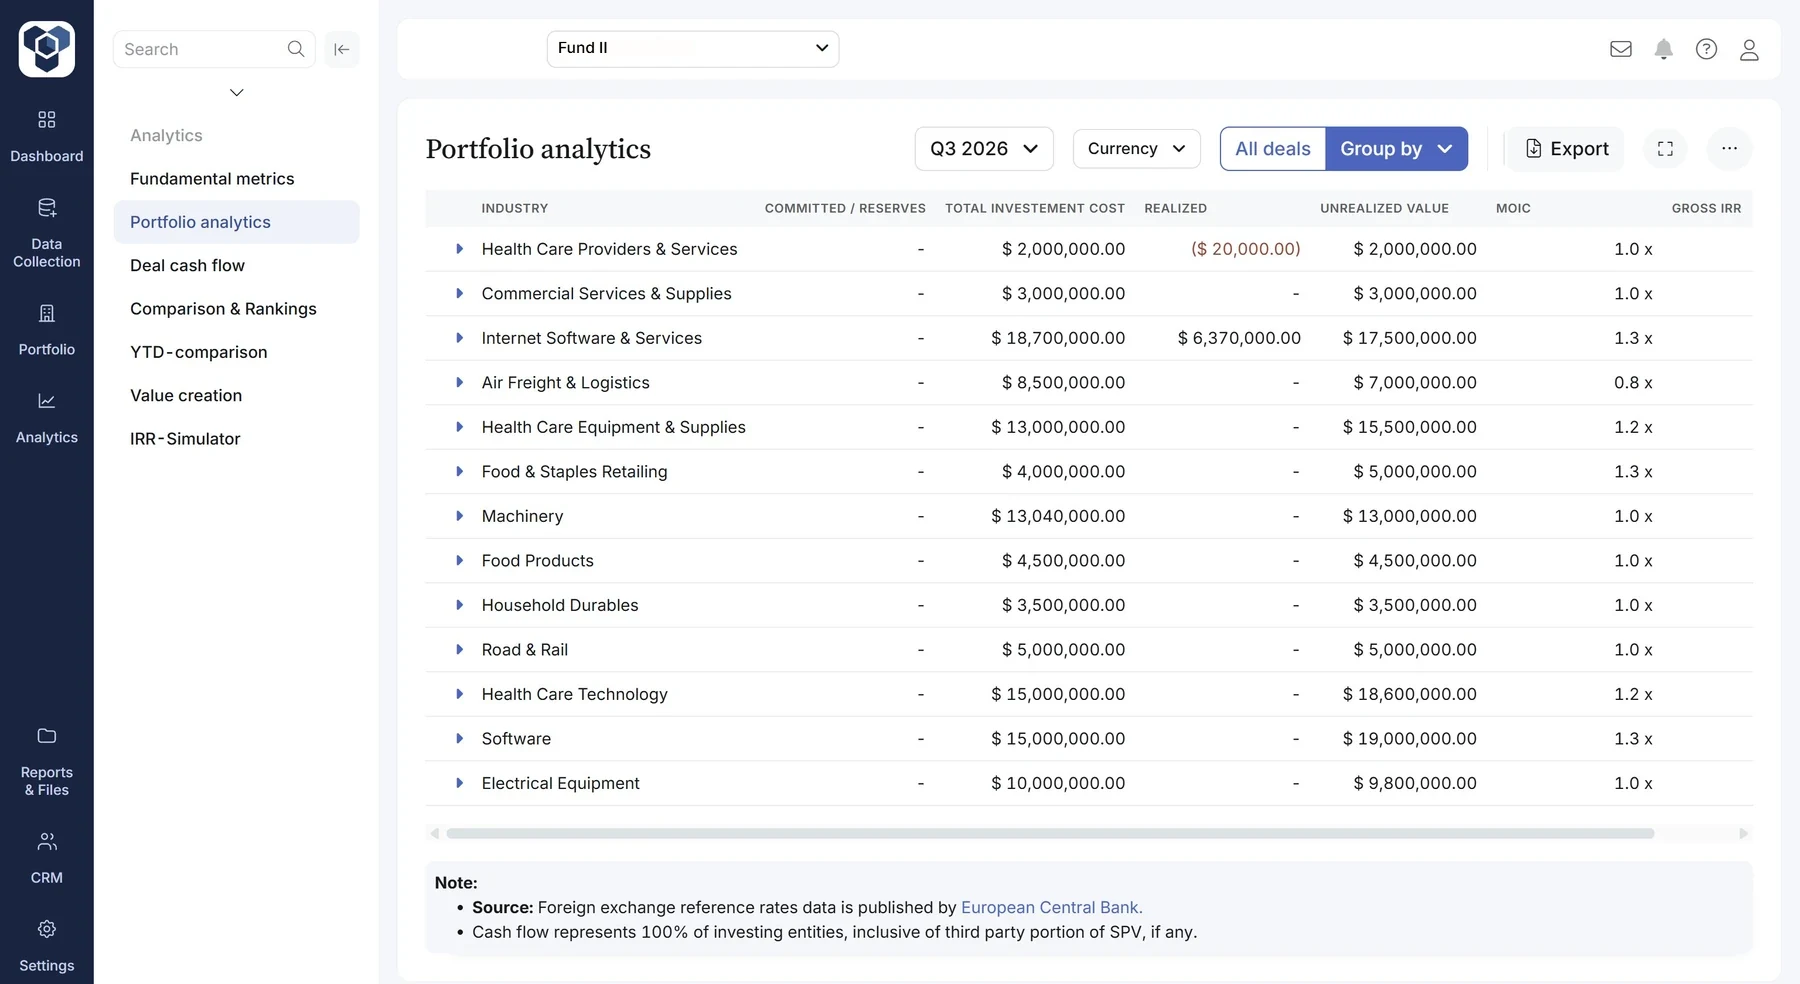
Group the portfolio by industry, country, fund or any field you track, and see cost, realized and unrealized value, MOIC and gross IRR for each group. Value creation analysis splits each deal's change in value into top-line growth, margin expansion, multiple expansion, de-leverage, change in ownership and FX.
Use configurable tables, charts and reporting layouts to prepare quarterly portfolio packs, company one-pagers and internal management updates. Refresh the period and approved data instead of recreating slides each quarter.
The team can see what changed, where the data came from and which company needs attention.
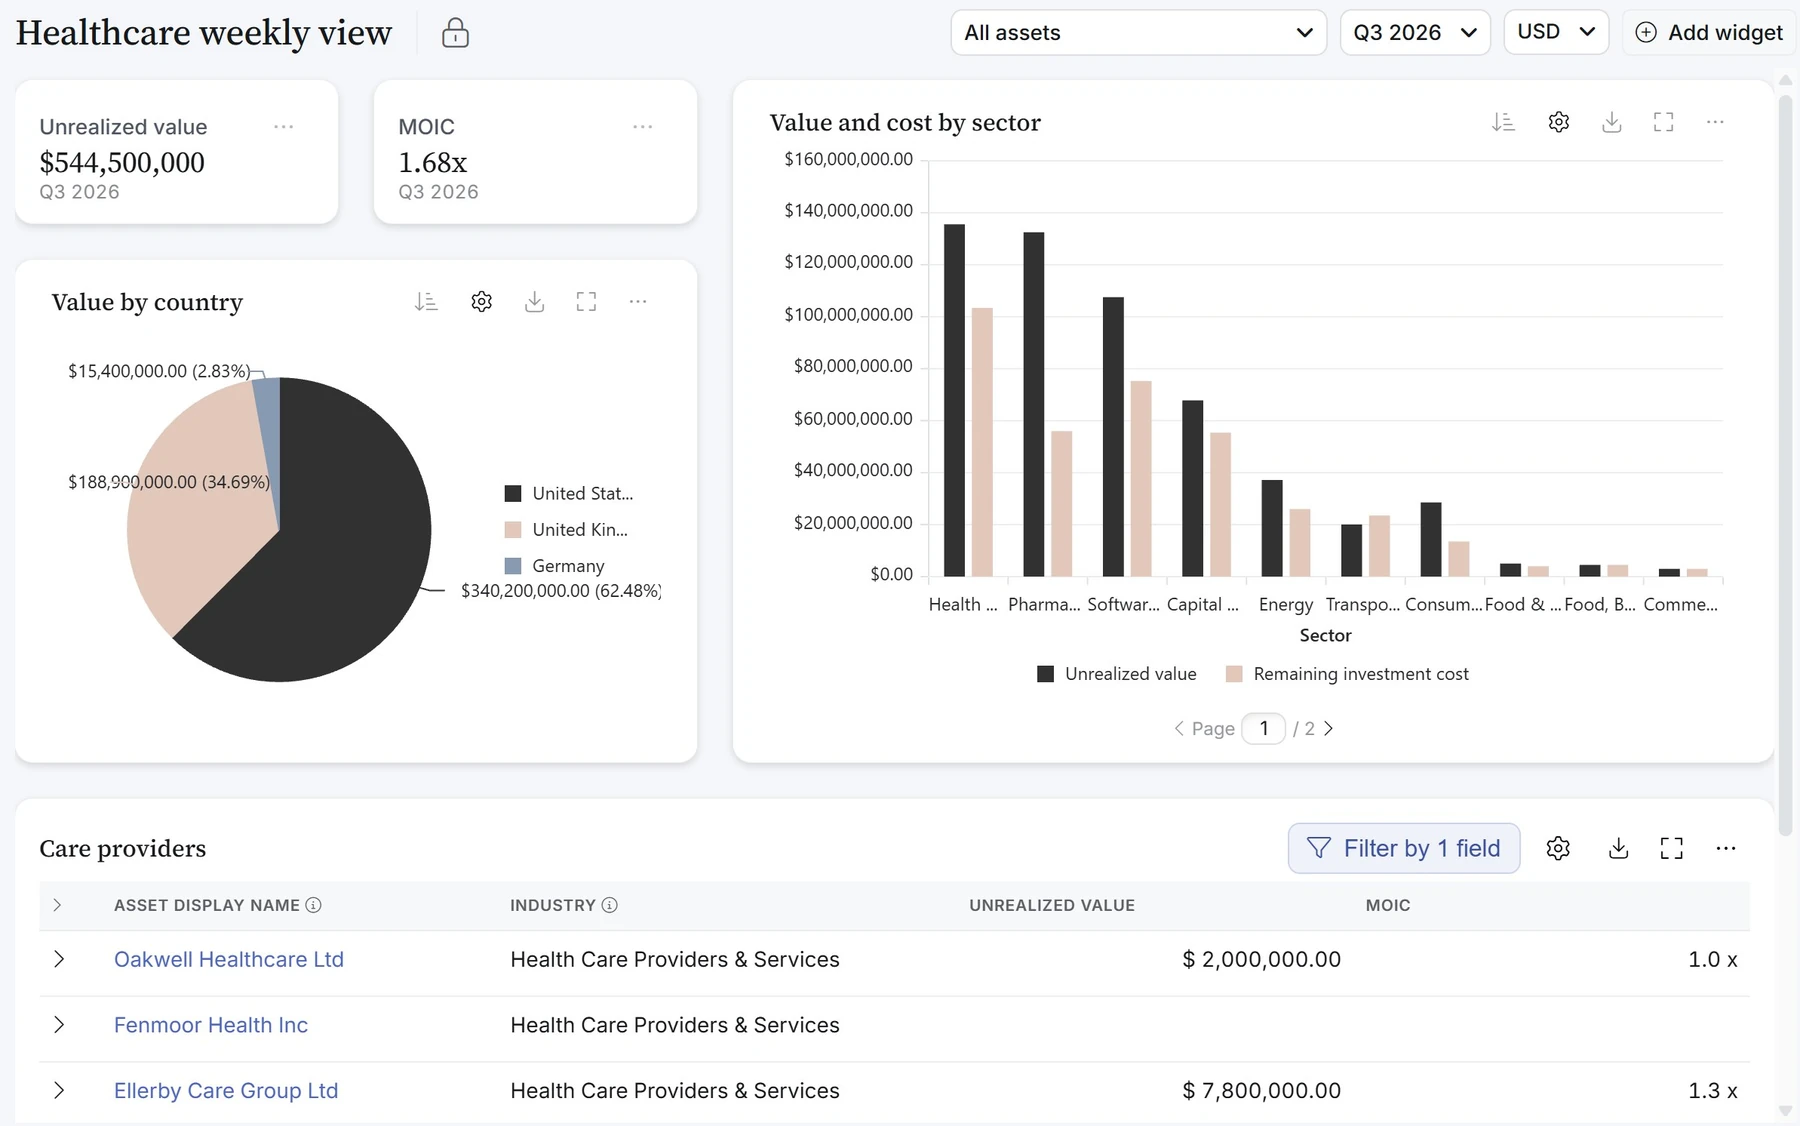
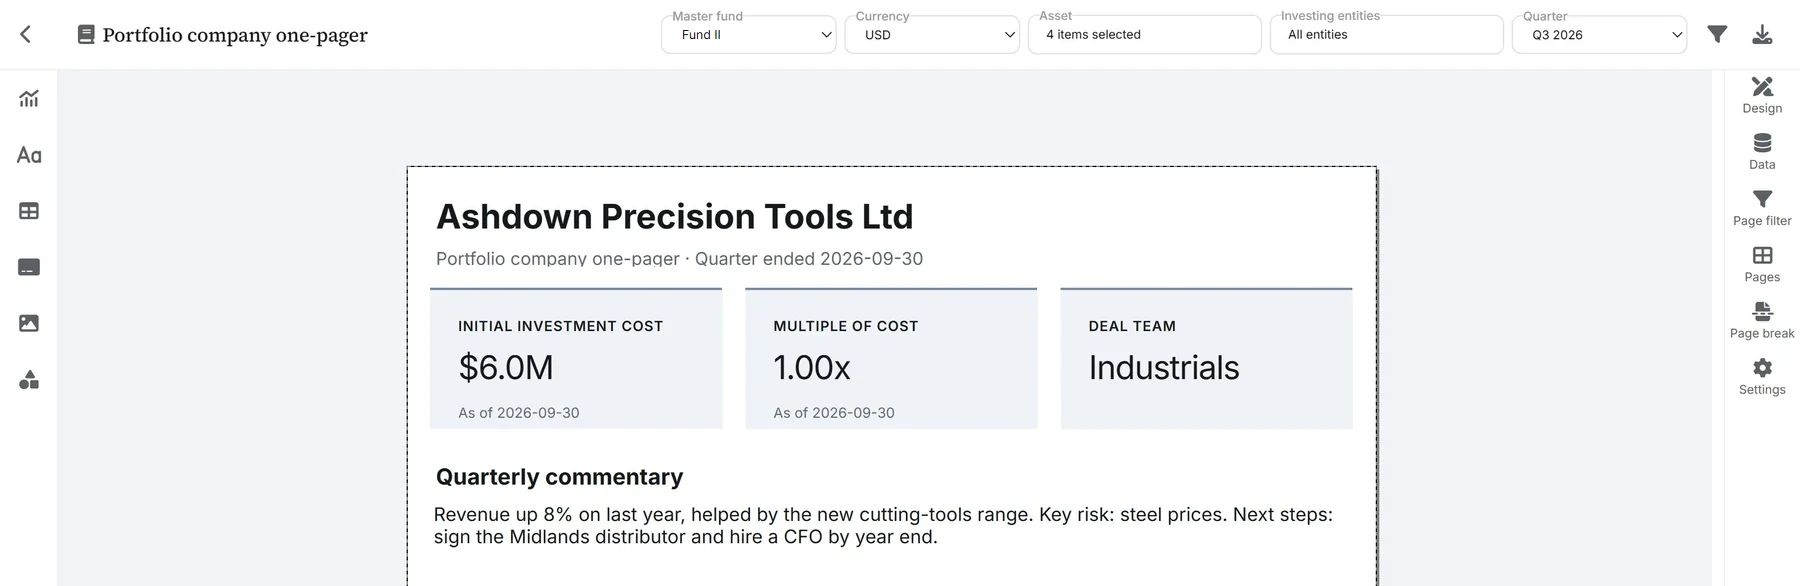
Design the One-Pager once in SmartPage: headline figures, the deal team and the quarter's commentary. Each quarter it fills in for every company in scope, one page each, ready to share or download.
b2venture
Venture Capital
How b2venture built a single source of truth for its team and its investors.

AfricInvest
Private Equity
How AfricInvest changed the way it manages portfolio information and reports to investors across its funds.
Portfolio monitoring in Quantium collects portfolio company KPIs, valuations and ownership each quarter and links them to the funds that hold each company. Teams request data from companies, review it before it is used, and see performance, exposure and valuation history next to fund and investor figures.
Not necessarily. Quantium works with standard collection formats and supported PDF and Excel ingestion. Mappings and validation are configured for the chosen source files.
Yes. Quantium supports portfolio, investment and fund reporting views, with user access configured for each team.
No. Portfolio Monitoring covers post-investment data collection, metrics, valuations and reporting. A firm can keep its separate CRM.
Yes. The reporting tools support configured layouts and repeated reporting periods, with scope agreed for complex existing templates.
Bring one of your existing KPI packs and see how collection, review and reporting work.